Overview
How many times have we run SQL queries on RDBMS, extract data, copy it to excel sheet and plot simple trend charts? Why don’t use any of the existing BI or reporting tools? The overhead of using heavy weight BI tools is little too much for a simple report/charting requirement. Firstly, you need to have a licensed version, trial versions are good but they don’t offer continuity. Secondly, there is a learning curve associated in building reports, no one lets you transform SQL queries to chart directly, you need to know the product in building even a simple report.
Query2Report addresses both these limitations. Query2Report provides a simple opensource business intelligence platform that allows users to build report/dashboard for business analytics or enterprise reporting with following features
- Transforms bunch SQL queries to beautiful google charts
- Supports real time reporting with automatic refresh functionality
- Data from multiple database instance can be pulled and displayed in a single report
- Role based security allows the users to create public or personal reports
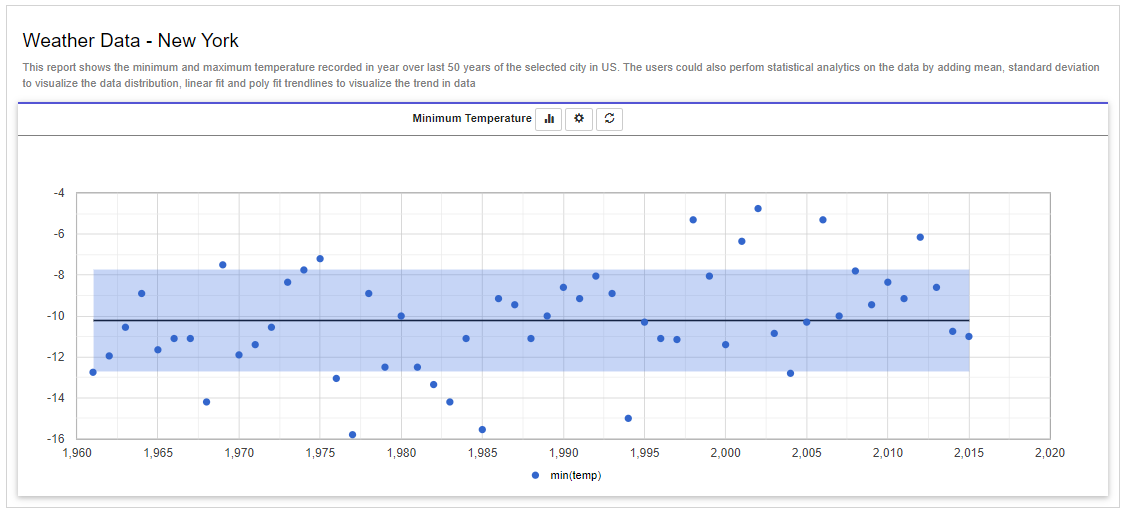
- Statistical analytics like mean and standard deviation can be plotted on the same chart as of the reported data.
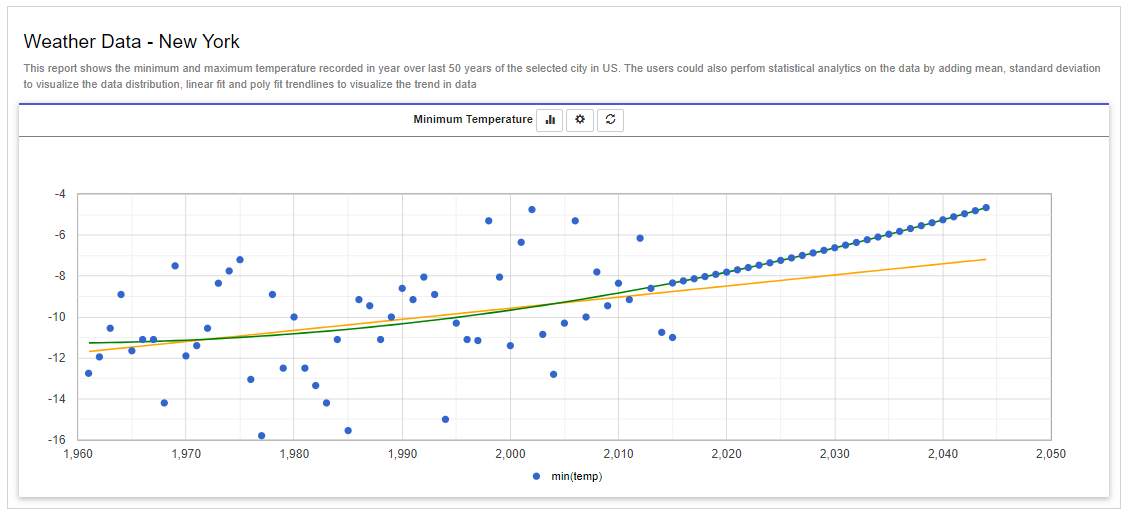
- Forecasts using linear regression, plots observed and predicted values on the same chart
- Angular JS is used to build this application as a SPA and HTML 5 responsive user interface design makes it run on seamlessly laptops, mobiles and tablet
Chart Types
The software uses google charts for data visulization, following are the chart types supported.
- Line Chart / Line with time Range Slider
- Bar Chart / Stacked Column Chart
- Column Chart/ Stacked Column Chart
- Scatter Chart
- Area Chart / Stepped Area Chart
- Table Chart
Statistics Supported
Statistics that can be reported along with observed values on the same chart
- Mean
- Standard Deviation
Forecast Supported
The software uses linear regression algorithms to plot predicted and observed values on the same chart. Software supports following fitments
- Linear
- Quadratic
- Quartic
Video tutorials
- Concepts
- Report Showcase
- Data Analytics Demo
- Data Forecasting Demo
- Getting Started
- Building First Report
Downloads
Sample Report
Report sample showing forecasting using linear and poly fitment regression algorithm
Report sample showing mean and standard deviation for visual data analytics
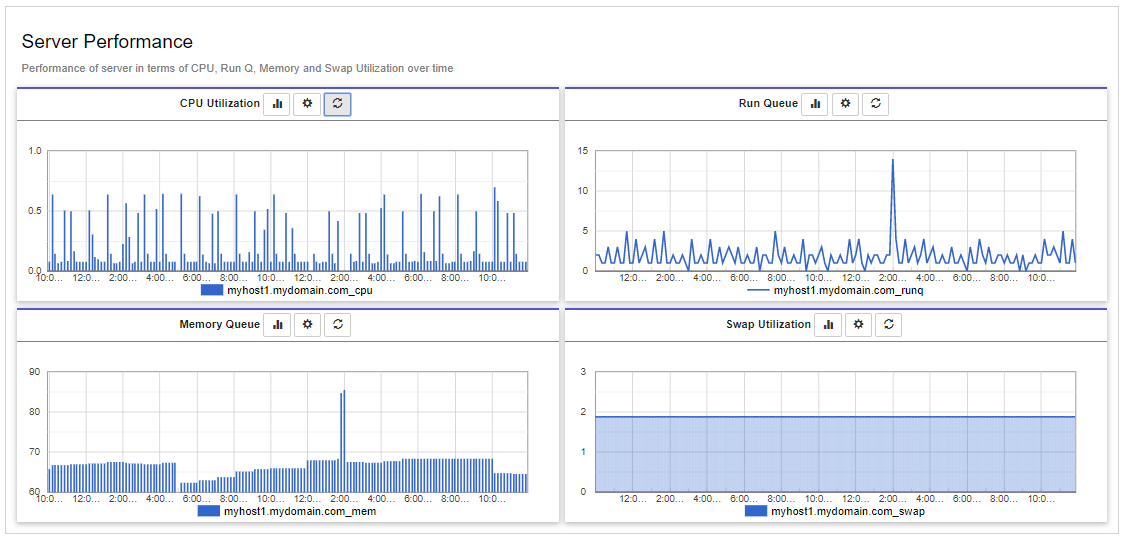
Report showing system performance in terms of CPU, Run Queue, Memory and Swap Utilization